This Windows program plots S-parameters for one or two Touchstone files. It generates impedance, admittance, and immittance Smith charts as well as rectangular plots. It displays wrapped or unwrapped phase, filtered or unfiltered group delay, file comments, and file data. It plots SWR and mismatch loss. It uses the S11 reflection, S21 or Y21 series-through, and S21 shunt-through methods to plot Z, L, Q, C, DF, and ESR. Version 2.45.
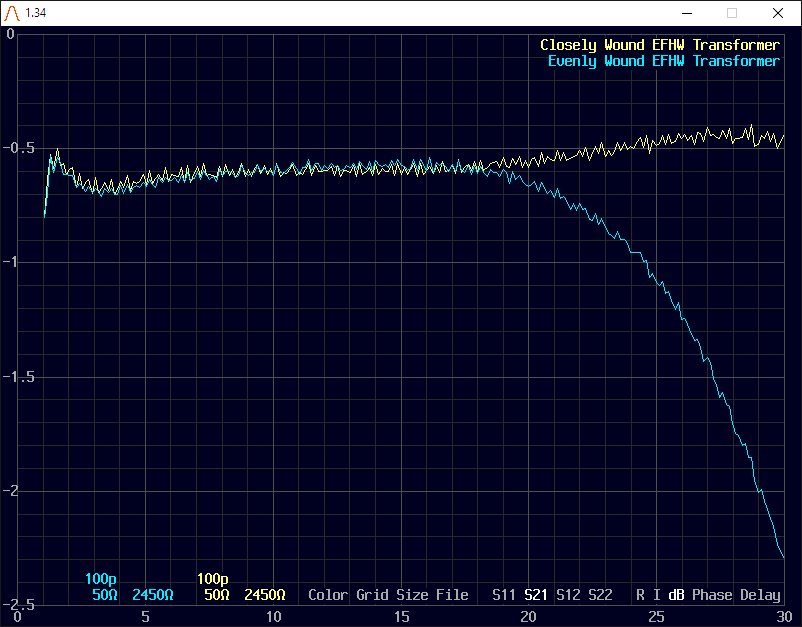
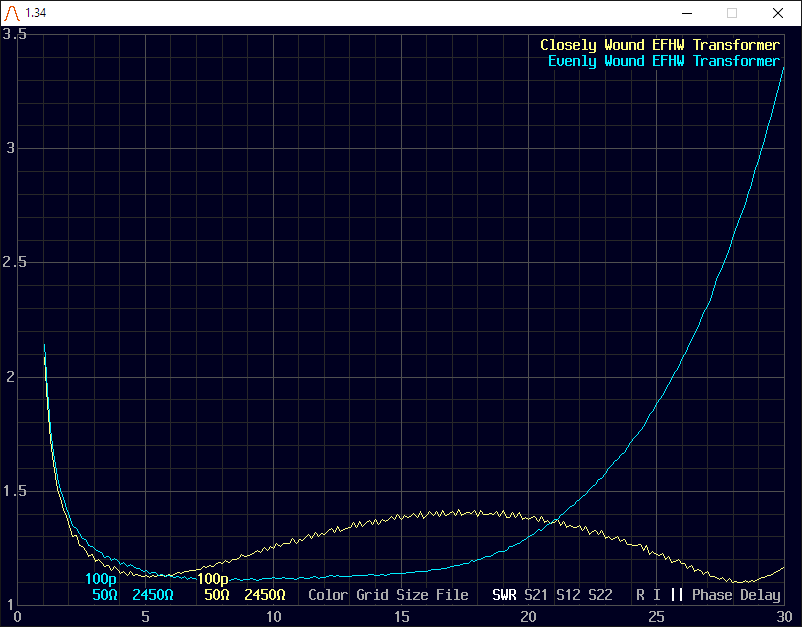
The program can renormalize the reference impedance. This lets you measure a device at 50 ohms and plot the response at its design impedance. No matching network is needed. The plots compare insertion loss and SWR for two winding techniques for a 1:49 ferrite transformer, the kind used with an end-fed halfwave antenna. The port impedances differ. Port 1 includes shunt capacitance.
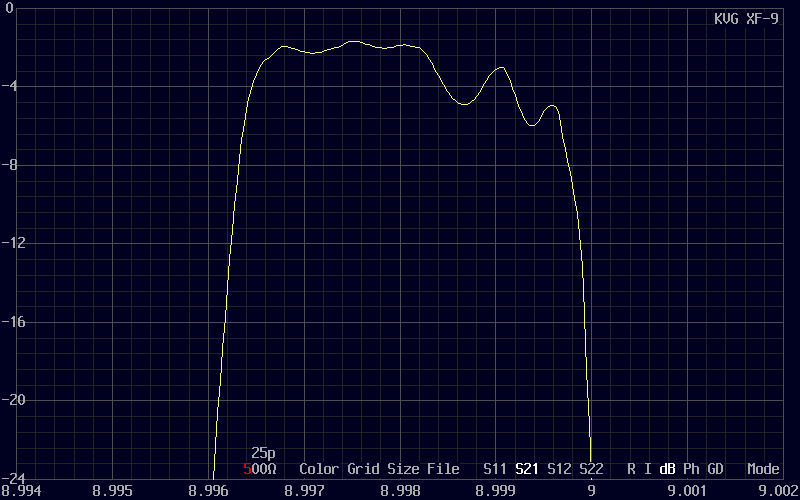
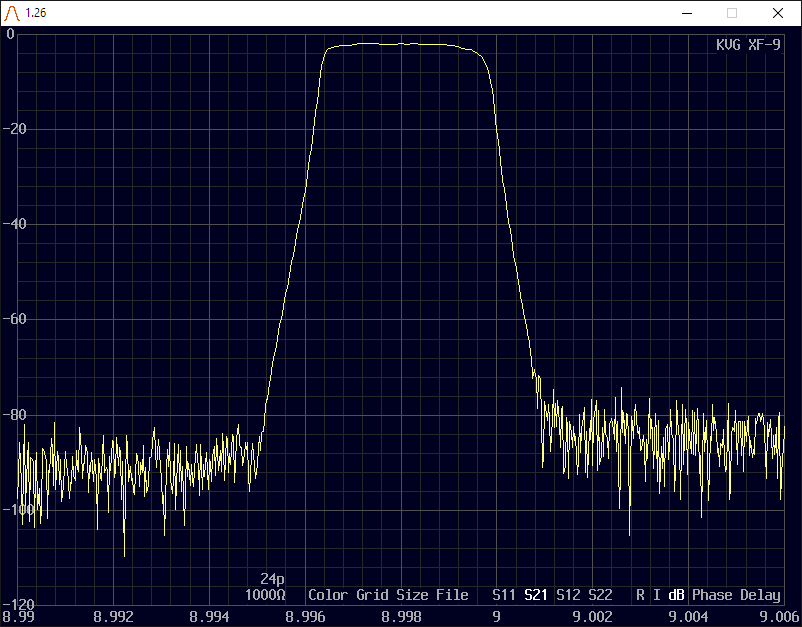
Rotate the mouse wheel to find the best termination impedance for a crystal filter.
Unwrapping crystal filter phase.
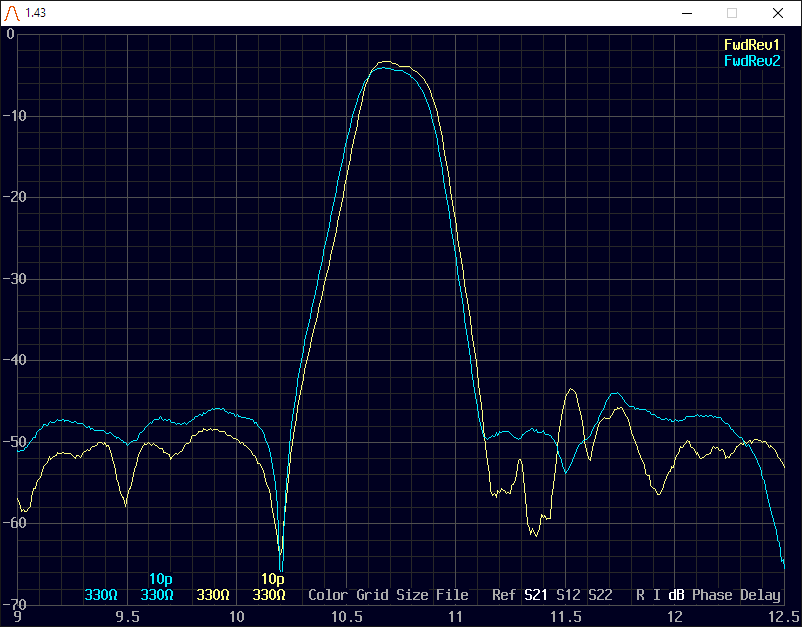
Highlighted bandpass filter frequency restriction with magnification.
Display data points as dots to reveal sampling anomalies.
 88–108 MHz